Technical Stock Analysis: Navigating Patterns & Prices
14 Apr 2022
Fortune-telling has no place in stock investing. We have no way of knowing if a stock’s price will rise or drop tomorrow or in the next few days… but did you know that there are technical analysts who aim to do just this?
They do what we call a technical stock analysis. Basically, what they do is attempt to predict the market prices using a variety of data, specifically trading volumes, past price movements, and even investor sentiments.
But technical stock analysis is, in no way, similar to fortune-telling.
There’s no crystal ball. There are no tarot cards. You just ought to base your decisions on patterns.
Still, don’t get the idea that technical stock analysis is easy to do. Conclusions from technical analysis don’t come from a quick look at the charts. Investors who do this kind of analysis use statistical methods to come up with logical decisions to buy or sell any stock.
Technical stock analysis at a glance
You might have been more familiar with fundamental stock analysis, as it is the bulk of what we do at the VI Community. But it wouldn’t hurt to know about other methods to analyse stocks, as our objectives in investing aren’t the same.
Allow us to differentiate fundamental and technical stock analysis first.
When we do fundamental analysis, we aim to find the true value of a company as we believe that the share price does not always reflect the stock’s intrinsic value. So we look at its economic moats, financial health, management, and how well the economy is doing, instead of getting anxious over price changes.
When we do technical stock analysis, we focus more on the price. We search for trends. We analyse price and volume fluctuations. We assume that the price would tell us all the information we need to know about a stock.
Instead of finding the real value of a company to determine when to invest, we would trade according to the price points and patterns, finding entry points to either buy or sell.
But it doesn’t mean technical analysts don’t mind a company’s financial health. They believe that the important numbers are already factored into the current stock price.
Another glaring difference between the two is the investment outlook investors possess.
Oftentimes, those who lean toward fundamental analysis intend to buy and hold stocks for the long term. Meanwhile, technical stock analysis is mostly done by traders, as they often adopt a faster investing pace.
So, if you’re a trader who wants to adopt technical stock analysis, read on and find out 4 of the many tools available.
1. Candlestick patterns
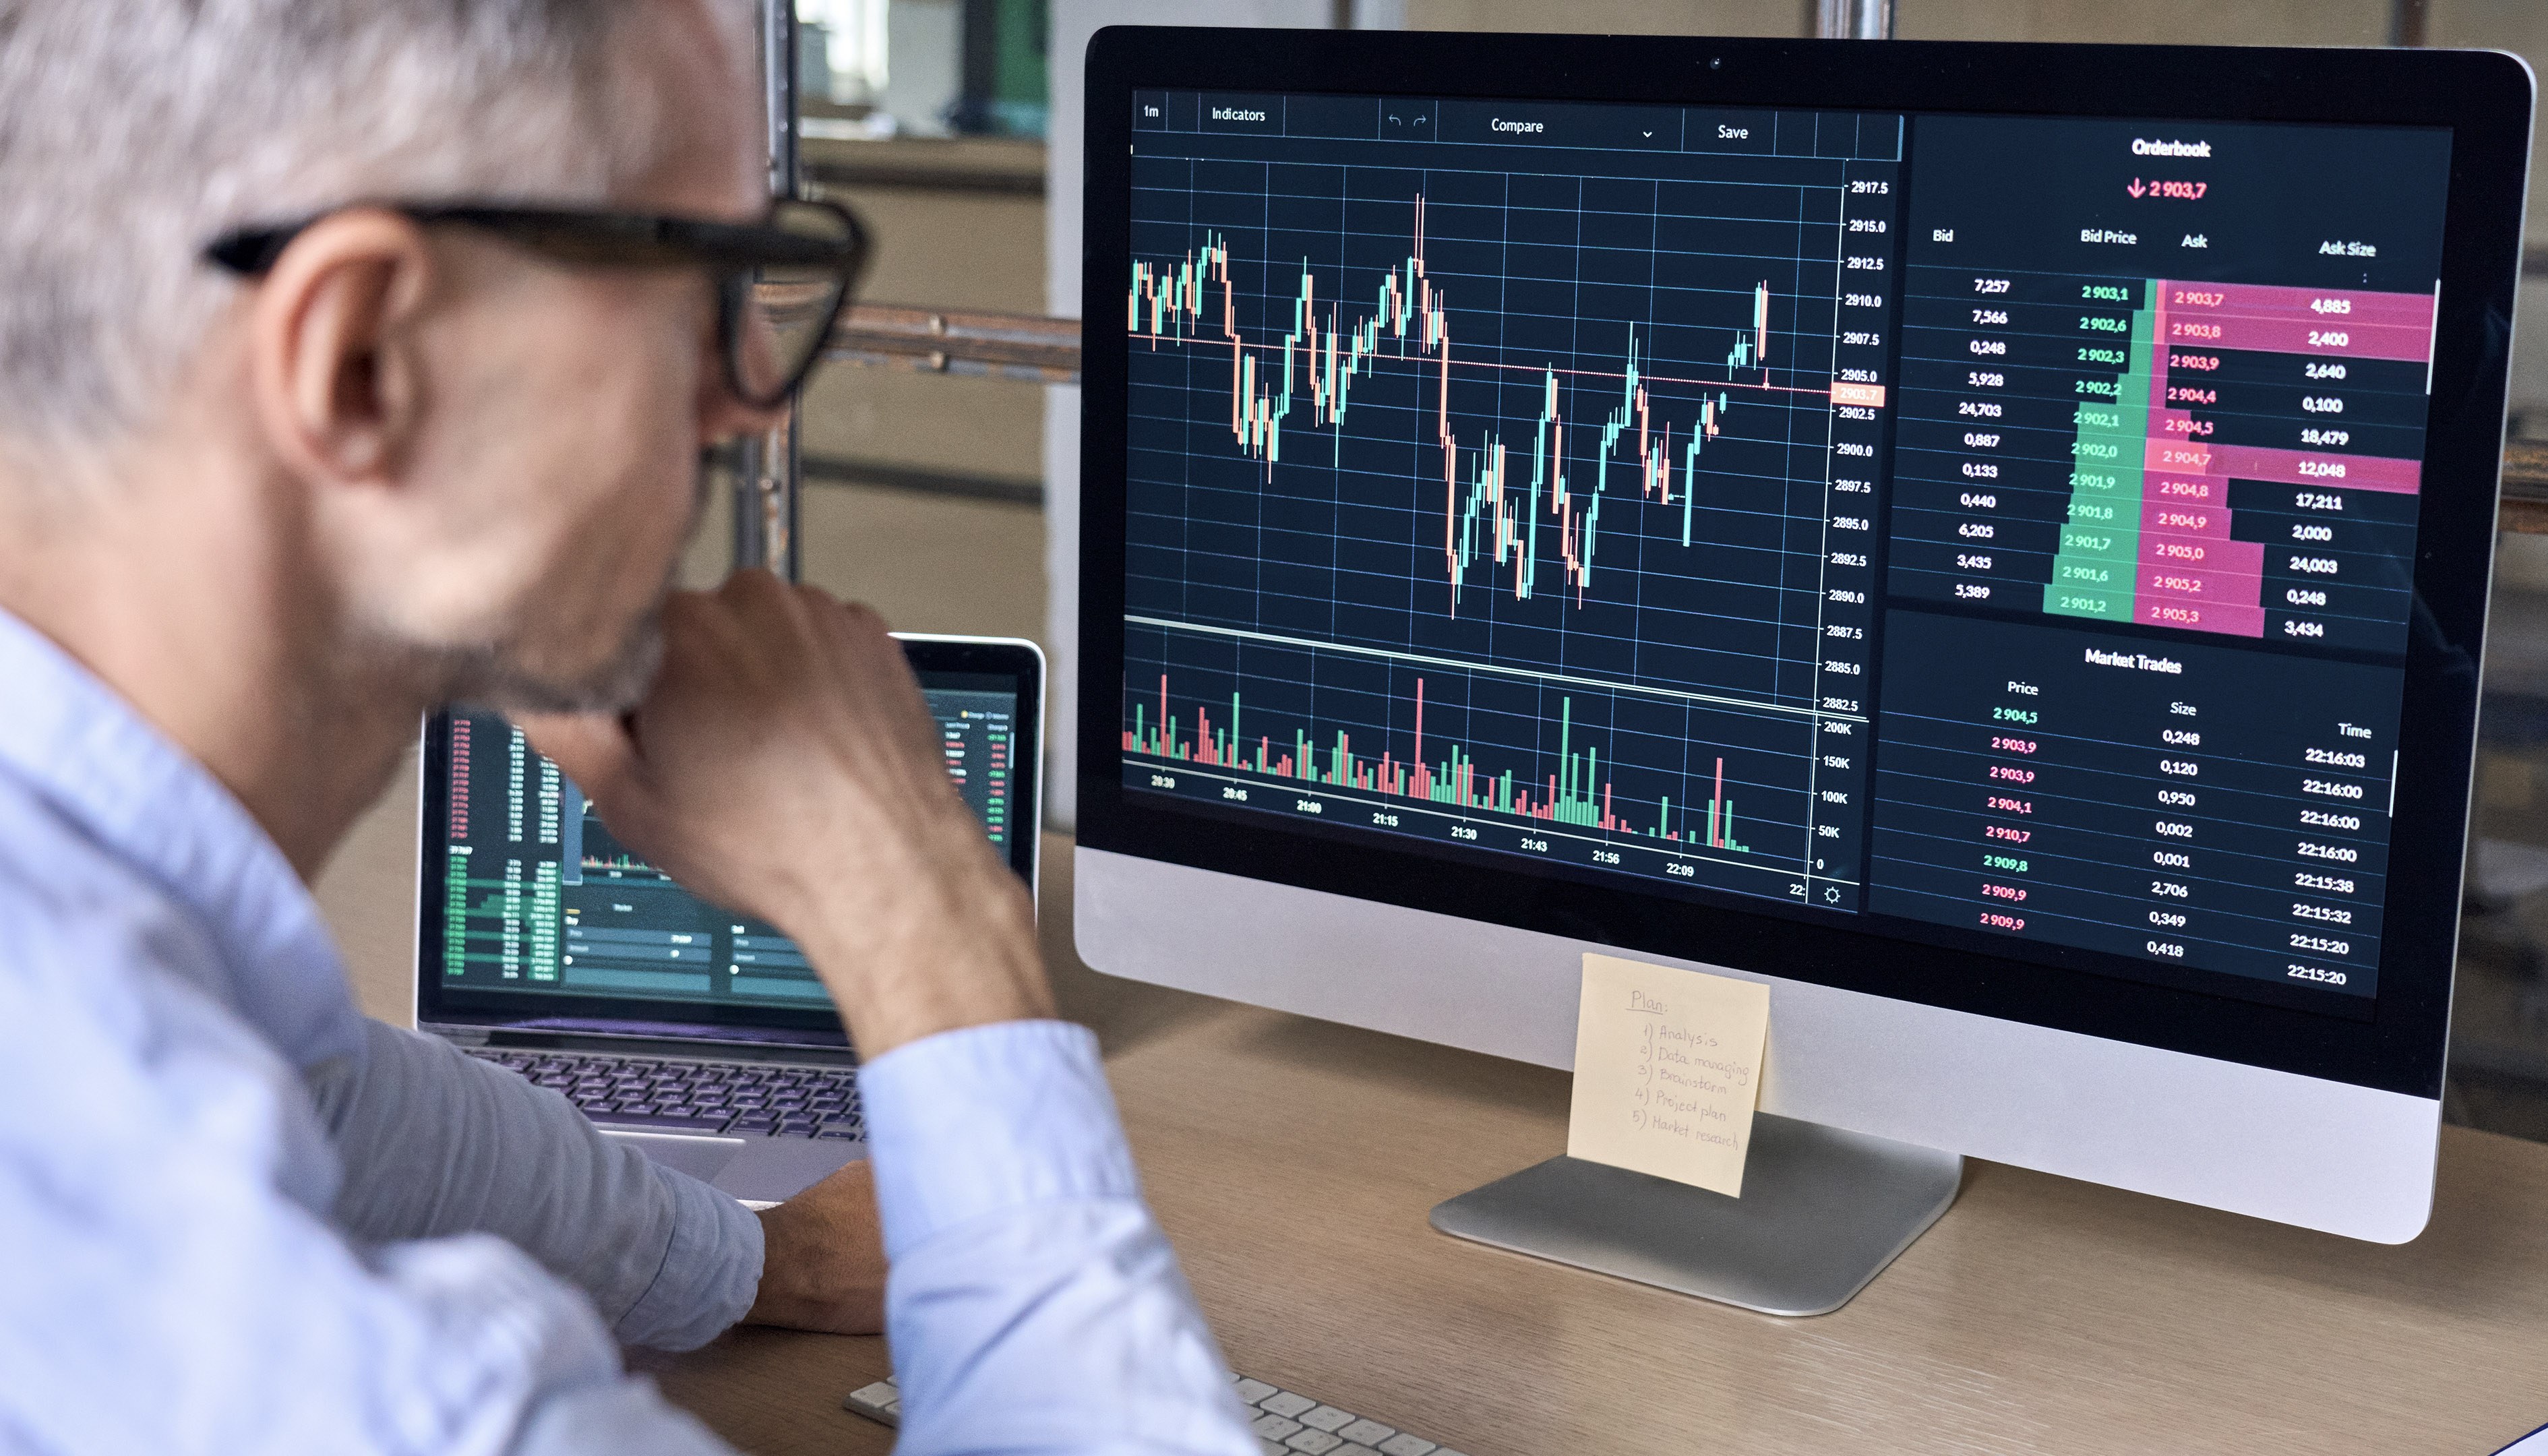
Probably the first image that comes to your mind upon hearing about stocks, candlestick charts are the most frequently used technical trading tool to predict price directions.
Its name is from when it was first used in Japan. Each time frame is illustrated as a rectangle where lines come out of the top and bottom, hence, an image similar to a candlestick.
In the stock market, a candlestick is generated by the share price over a specific period. Each candlestick on a 5-minute chart represents 5 minutes of price movement, whereas each candlestick on a 4-hour chart represents 4 hours of price movement, and so on.
Candlestick patterns are highly visual tools for technical analysis as you can see the current price as they move up or down.
The highest point on the candlestick reflects the stock's highest price, while the lowest point represents its lowest price.
When looking at candlesticks, you may notice a long line protruding from a large block. When we notice a thin line sticking out in this situation, it means the price changed quickly before returning to its original value. The area inside the block is where the price stayed the longest.
A candlestick design is made up of a single candlestick or a group of two or three candlesticks. This is one of the most-used technical indicators for identifying potential market reversals or trend shifts.
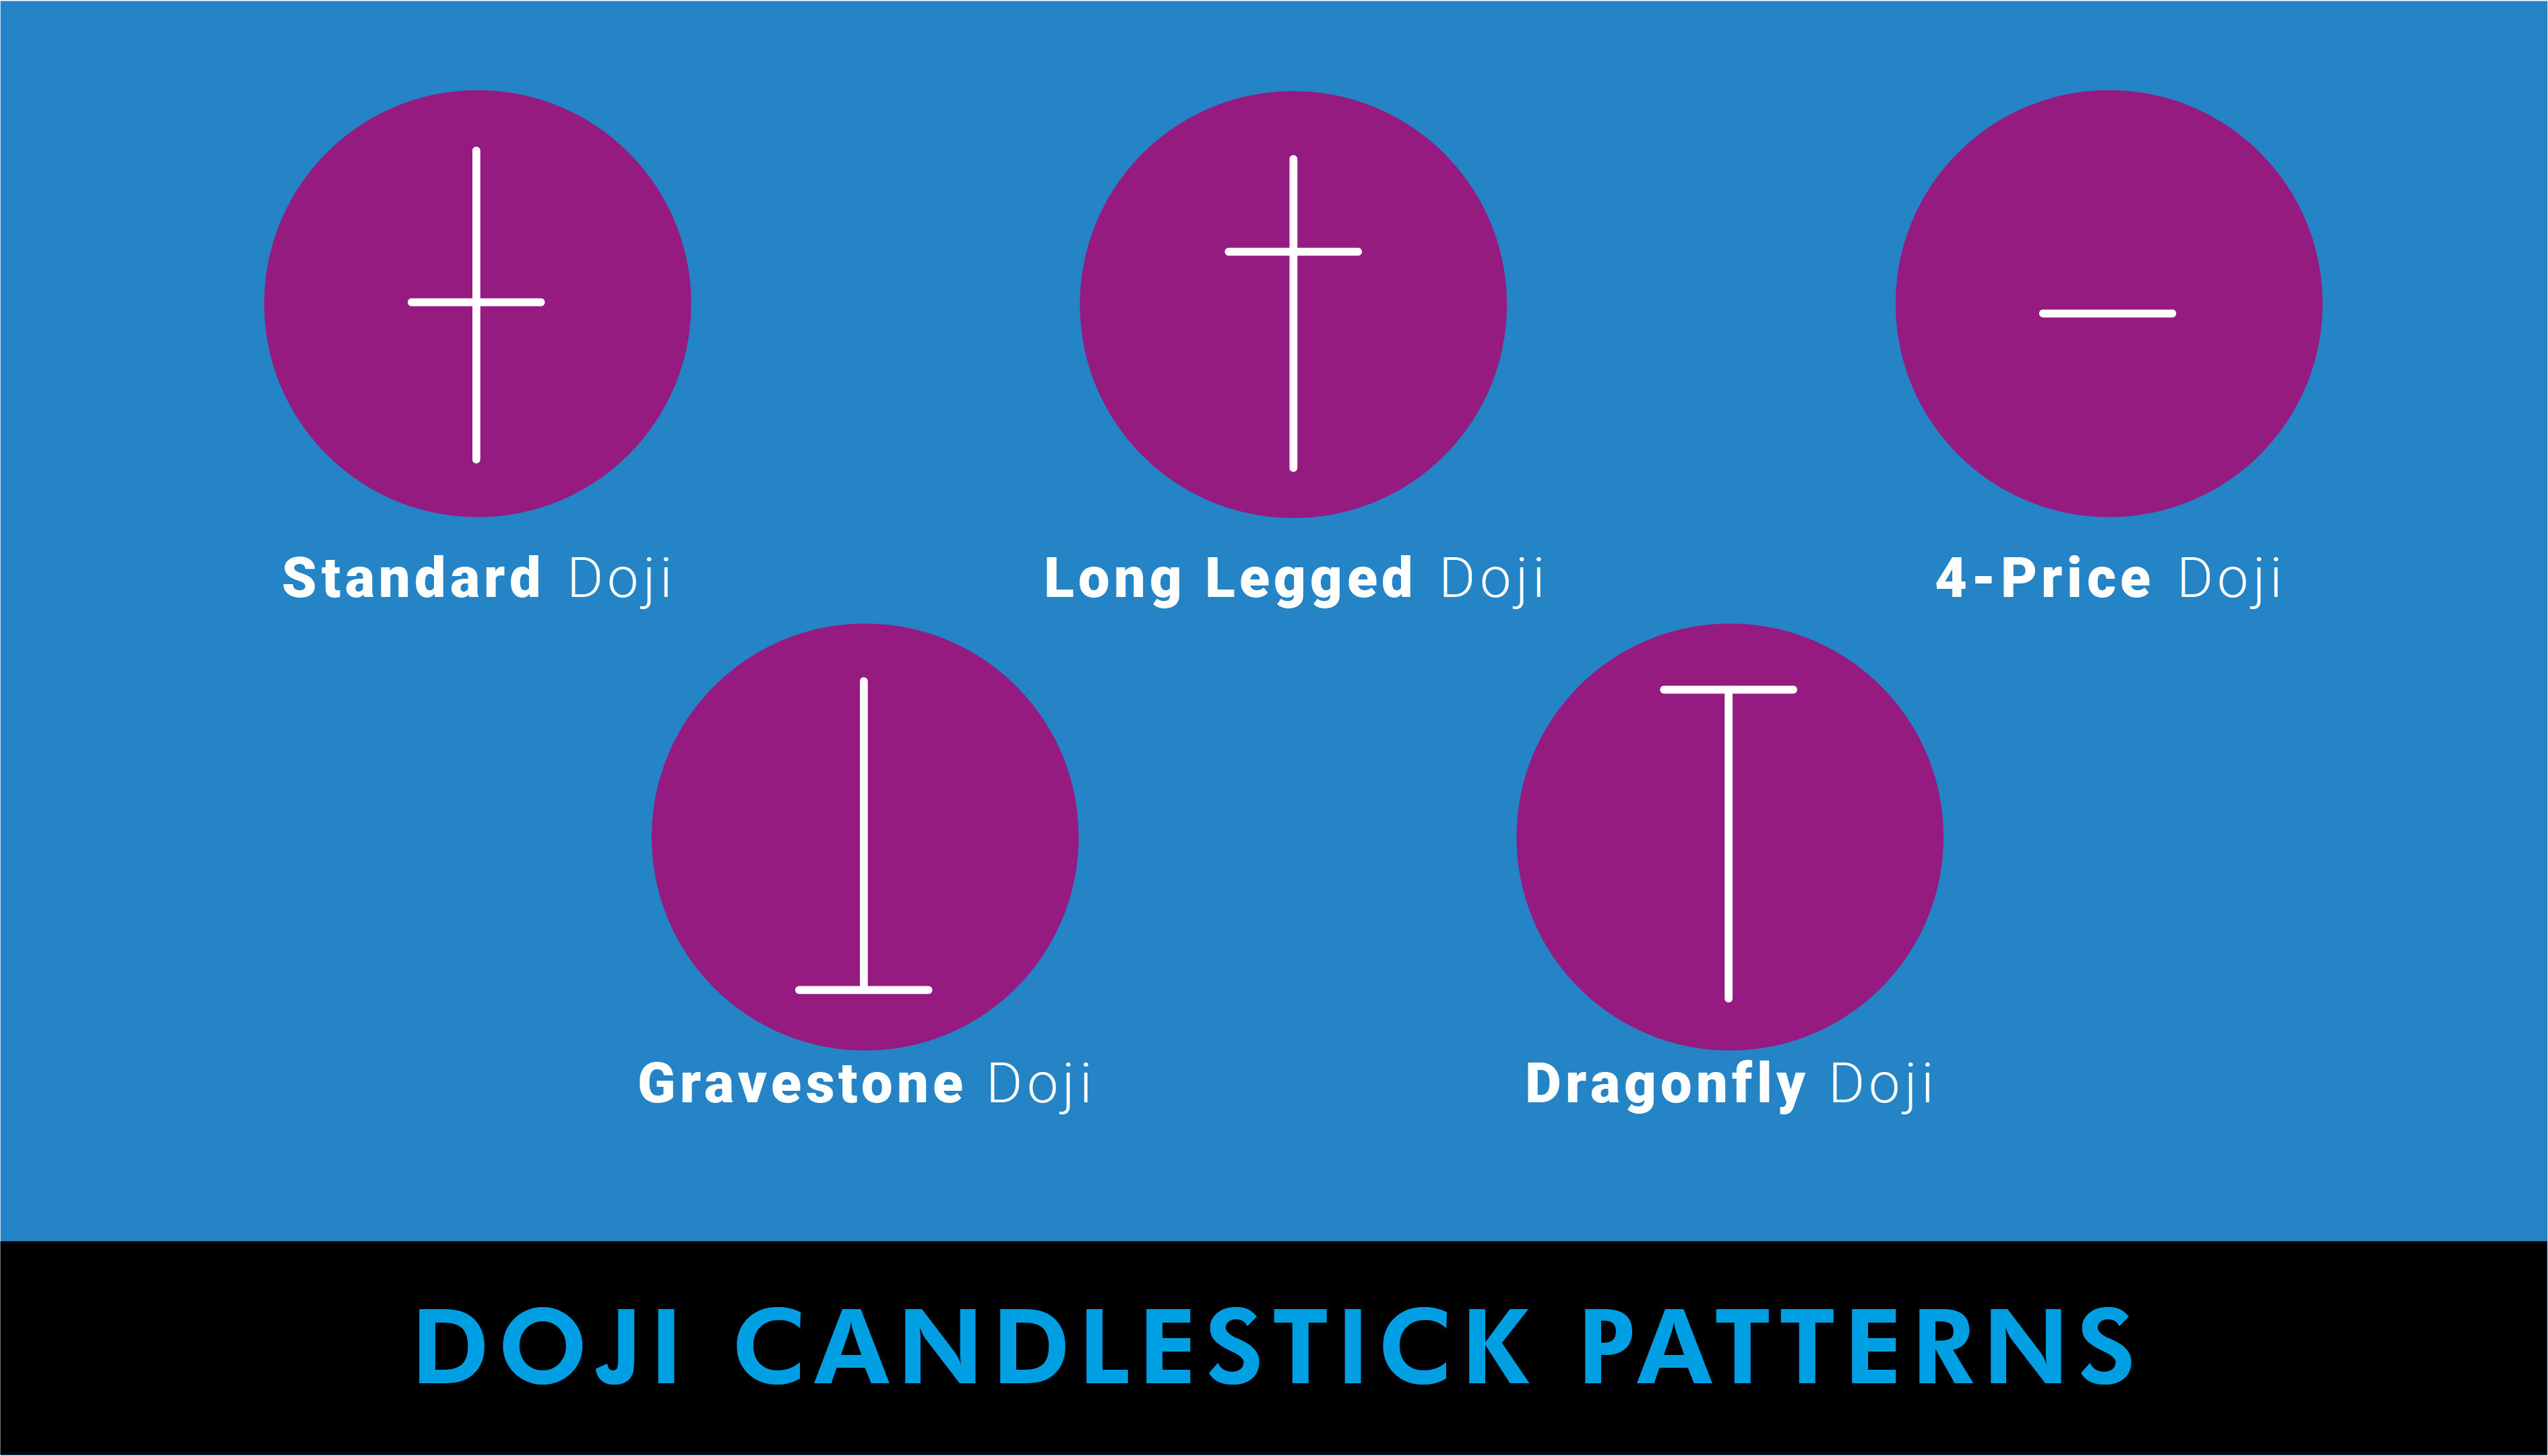
Doji candlesticks, for example, show market volatility and might signal a market reversal. A Doji candlestick is formed when the beginning and closing prices are the same, resulting in a flat candlestick body. The stronger the indicator of market volatility and potential reversal, the longer the top or lower line of a Doji candlestick.
Some types of Doji candlesticks are shown below.
2. Moving average
We may also use moving averages instead of candlestick patterns in technical stock analysis.
This tool indicates the average price over a certain period, as the name suggests. It helps determine if the stock price is trending upward or downward. We usually analyse multiple-day periods of moving average to see when the best moment to buy or sell is.
When the 15-day moving average, for example, crosses over the 30-day moving average, it indicates that the price is rising and that now is a good time to buy.
The more significant the price movement, the higher the moving average. Crossing above or below a 100-day moving average, for example, is usually seen as far more important than crossing above or below a 5-day moving average.
Simply put, if the average price over the next 15 days is higher than the average price over the previous 100 days, the stock's price is fast increasing.
3. Momentum indicators
Many indicators can help us find the beginnings of an upward or downward trend, but the momentum indicator uses several tools to predict if a current trend will be broken.
By analysing the strength of price movement, momentum indicators can help us determine if the present price movement will continue its trend or revert. Because momentum indicators measure the strength of a trend, they may be used to predict when one is about to come to an end.
For example, if a stock has been in a strong, long-term uptrend for several months but one or more momentum indicators signal that the trend is fading, it may be time to sell.
4. Pivot points
Pivot points would indicate when to enter or exit trades by identifying key levels of support or resistance. When the price of a stock exceeds the daily pivot and passes through support or resistance, it is called a 'breakout.' This will be a signal to enter or exit a trade since the market will change in the direction of the 'breakout.'
To create a daily pivot point, just draw support and resistance lines using the highs, lows, opening, and closing prices. Pivot point levels are usually displayed every trading day, and there are pivot point indicators you can use on a chart to do the work for you.
Even with these above tools, technical stock analysis is never flawless. No one can make 100% accurate forecasts about the stock market.
The most intelligent traders are constantly on the lookout for signs that the signals given by their chosen indicators are incorrect. When used correctly, technical analysis may help you raise your trading profits dramatically.
If you’re not into trading, don’t worry, we can help you learn about another strategy called value investing. Here’s a link to join our free masterclass.
Or perhaps you’re interested to do cryptocurrency trading? Then we invite you to come to our free masterclass on digital assets, the metaverse, and web 3.0. Here’s a link to secure your seat for this complimentary webinar.
DISCLAIMER
This article and its contents are provided for information purposes only and do not constitute a recommendation to purchase or sell securities of any of the companies or investments herein described. It is not intended to amount to financial advice on which you should rely.
No representations, warranties, or guarantees, whether expressed or implied, made to the contents in the article is accurate, complete, or up-to-date. Past performance is not indicative nor a guarantee of future returns.
We, 8VI Global Pte Ltd, disclaim any responsibility for any liability, loss, or risk or otherwise, which is incurred as a consequence, directly or indirectly, from the use and application of any of the contents of the article.